Intelie
Interactive React dashboards and Highcharts visualizations for real-time oil and gas operations analytics, built during my ViaSat engagement.
About the project
I contributed to Intelie's Performance Optimization work through interactive dashboards and data visualizations for real-time oil and gas operations. I integrated complex datasets into React interfaces using Highcharts, collaborated with backend teams on data accuracy and performance, and improved the usability and performance of data-heavy internal analytics tools.
Interface views
Select an image to view it at full size.
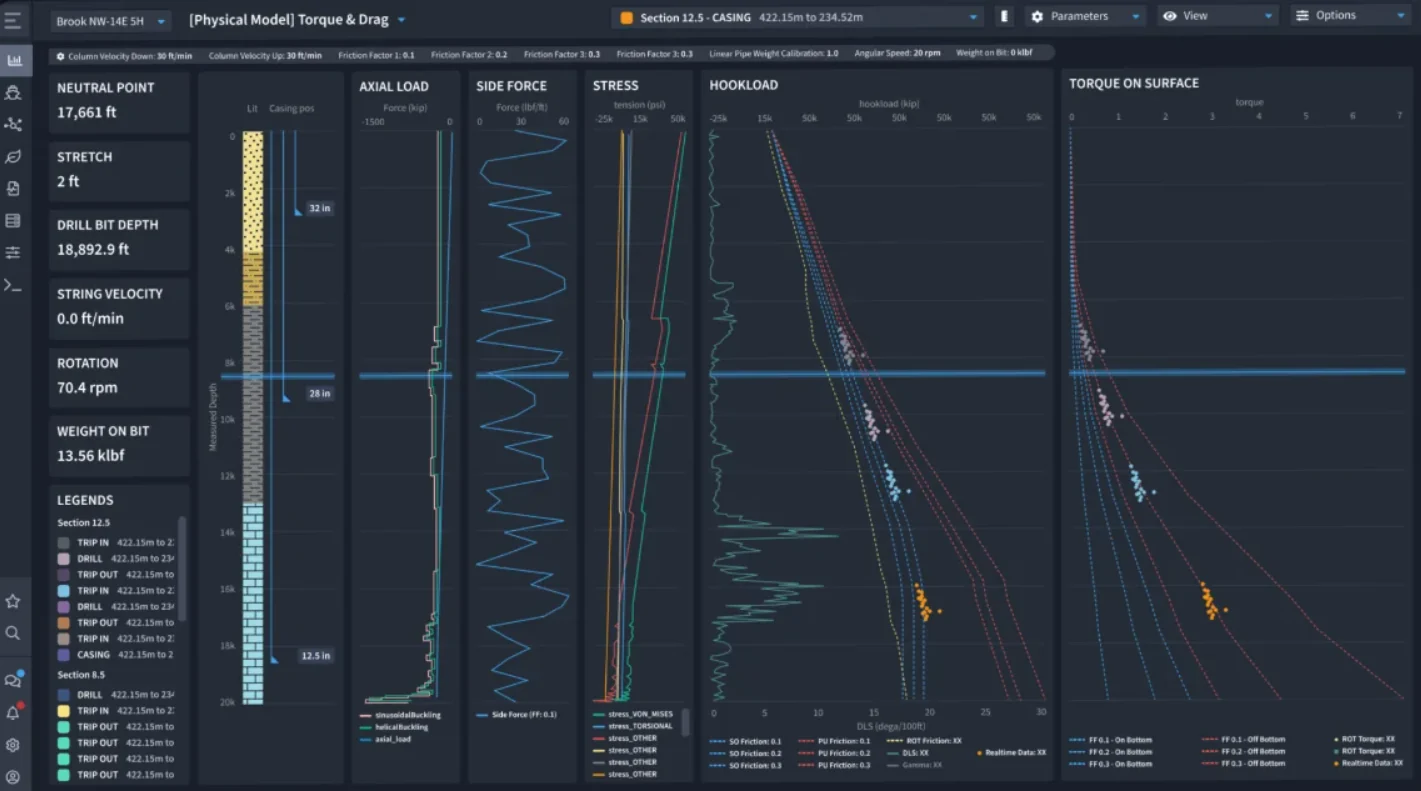
Intelie: coordinated charts for drilling and operational data analysis.
Image provided